Mobile trading costs more than the commission shown beside the buy button. The useful figure is the total cost of opening, holding and closing a position, plus any charges for funding the account or moving money out. A free app download tells you very little about that figure.
Separate explicit fees from costs built into prices. Commissions, subscriptions and withdrawal charges appear as deductions. Spreads, currency conversion markups and execution differences can be less obvious. Which matters most depends on what you trade, your order size and how long you hold positions.
This guide explains how to identify those costs and compare them using your own trading activity. All rates and calculations in the examples are hypothetical, not current prices from a provider.
What Does Mobile Trading Actually Cost?
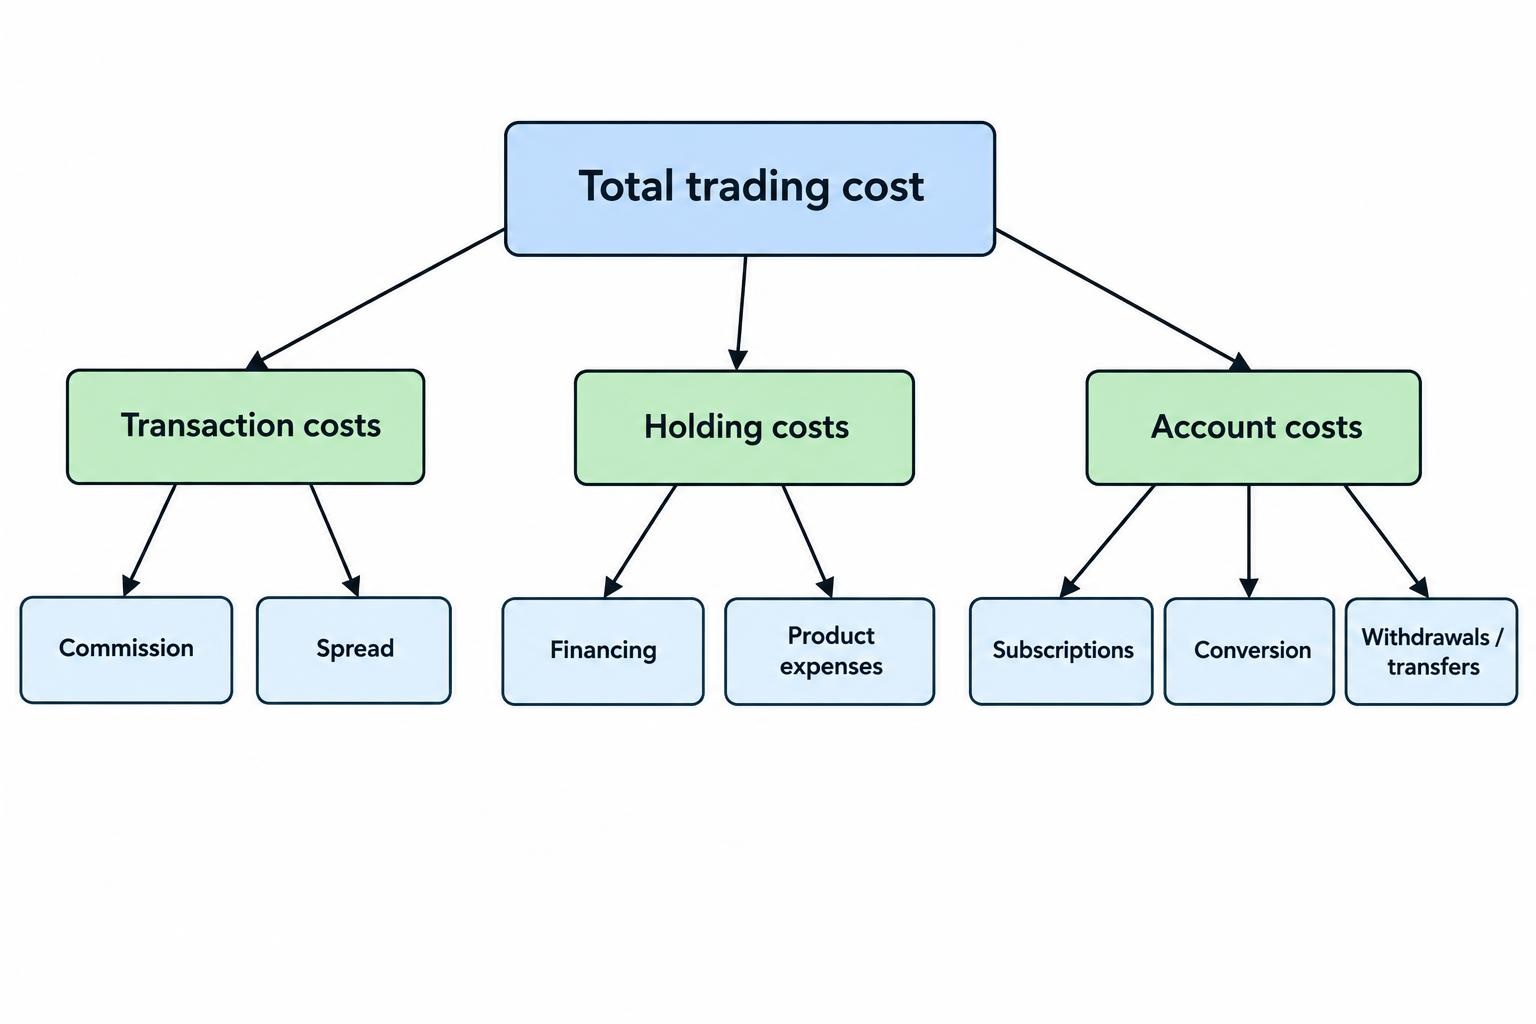
Start with three layers: transaction costs, holding costs and account costs. The SEC investor bulletin on investment fees distinguishes transaction charges from ongoing expenses and identifies other brokerage charges, including platform, inactivity, transfer and wire fees.
| Cost | When it matters | What to check |
|---|---|---|
| Commission | When an order executes | Charge per order, share or contract, including minimums |
| Bid and ask spread | When buying or selling | The difference between executable buy and sell prices |
| Financing or borrowing | While holding an eligible position | Rate, calculation basis and charging period |
| Currency conversion | When money changes currency | Conversion percentage, minimum fee and exchange rate |
| Account and service fees | Monthly, annually or after an account event | Subscriptions, inactivity, withdrawals and transfers |
| Product expenses | While holding certain investments | Fund operating expenses and other product charges |
Not every account incurs every charge. Use the table as a reading checklist, not an estimate of what you will pay. Also check whether a quoted price applies to your country, account type and chosen market.
Commissions: Read Beyond “Zero”
A zero commission offer answers one question: whether the provider charges a dealing commission for an eligible transaction. It does not answer whether that transaction involves a spread, conversion charge or other expense.
Check the boundaries of the offer. Does it cover the securities you intend to trade, or only selected domestic stocks? Does another schedule apply to options, foreign exchanges or orders placed with staff assistance? Keep the fee schedule for the actual account beside the promotional page.
Minimum commissions deserve particular attention on small orders. Suppose a provider charges 0.1% of trade value with a $2 minimum. A $200 purchase costs $2, not $0.20. That is 1% of the purchase amount before any selling costs. On a $5,000 purchase, the same schedule produces a $5 commission, or 0.1%.
For contract based pricing, count every contract on every leg. A hypothetical options order with four legs and two contracts per leg contains eight chargeable contracts if the schedule charges per contract. Then check closing, exercise and assignment terms rather than assuming the opening fee covers everything.
Spreads and Execution: Costs Inside the Price
How the bid and ask spread affects a trade
The bid is the price available to sellers; the ask is the price available to buyers. Their difference is the spread. You do not need a separate fee deduction for that difference to affect your result.
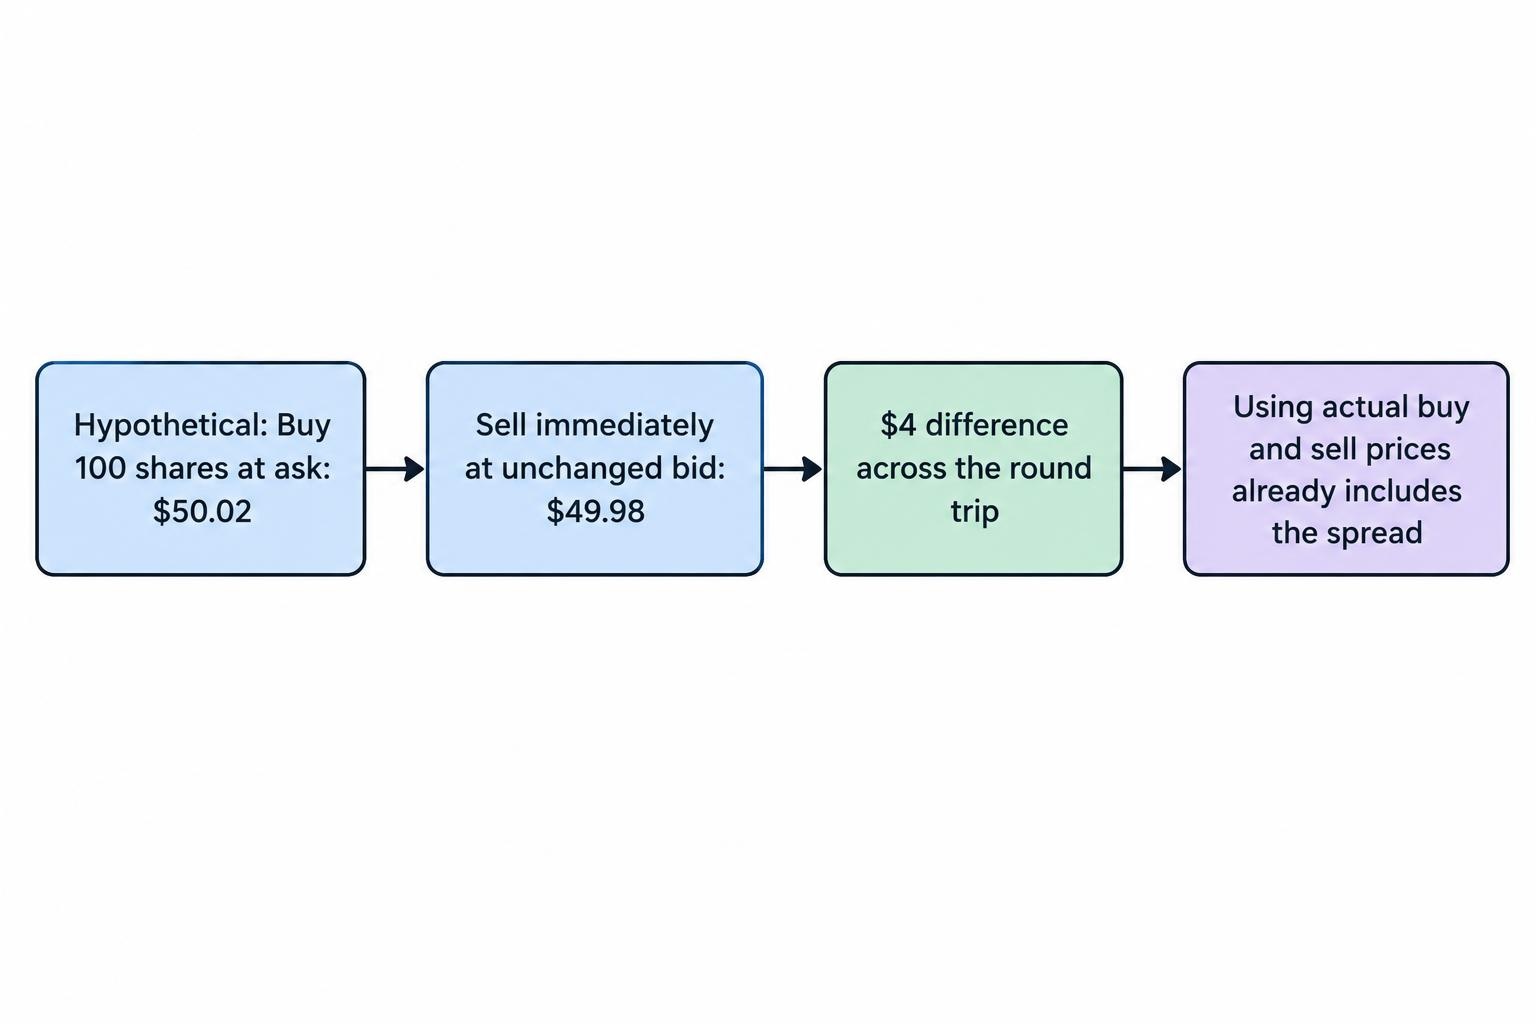
Suppose a stock has a $49.98 bid and a $50.02 ask. Buying 100 shares at the ask costs $5,002. Selling immediately at the unchanged bid returns $4,998. The $4 difference represents one full spread across that immediate round trip, before commissions.
Do not count that same spread twice. If your calculation already uses the actual purchase and sale prices, its effect is already included. Adding another spread deduction would overstate the cost.
Why the displayed quote may not be your fill
Execution introduces another variable. A market order does not guarantee the price displayed before submission. A limit order controls the worst acceptable execution price but may not fill. These tradeoffs are covered in FINRA’s explanation of order types and execution prices.
For a hypothetical purchase of 100 shares, a fill at $50.05 rather than the $50.02 ask you noted adds $3 to the purchase cost. That difference is not necessarily a broker fee: the market may have moved between your observation and execution.
On mobile, expand the order ticket before confirming. Check the bid, ask, quote timestamp, order type and quantity. A large last traded price at the top of the screen is not a promise that your order will execute there. The buy button is convenient; the arithmetic remains your responsibility.
Holding Costs: Margin Interest and Overnight Funding
Holding time can change which account is cheaper. A trader who closes positions within a session should not use the same cost assumptions as someone who holds borrowed exposure for several weeks.
For securities bought with a margin loan, interest increases the return needed to break even. Rates and account netting arrangements differ between firms. The SEC bulletin on margin interest identifies questions to ask about accrual, variable rates and whether cash elsewhere in the account reduces borrowing.
A simple estimate is borrowed balance multiplied by the annual rate, multiplied by the holding period as a fraction of a year. At a hypothetical 10% annual rate, borrowing $3,000 for 30 days costs about $24.66 using a 365 day basis. The actual agreement may use another day count, changing balances or different interest treatment.
Do not use that calculation interchangeably with derivative funding. For CFDs and rolling forex products, where available to you, inspect the instrument’s funding terms and the exposure used in the calculation. Your cash deposit may not be the amount on which funding is charged.
The FCA’s review of CFD pricing and overnight charges identifies wide differences in funding fees and concerns about how clearly those costs are communicated. Check the applicable rate, cutoff time, calendar treatment and any markup before holding a position overnight.
If you intend to sell securities short, request the stock borrowing terms separately. Do not assume a margin interest quote also describes the cost of borrowing shares.
Currency Conversion, Deposits and Withdrawals
Currency conversion belongs in the trading budget whenever your funding currency differs from the currency you need for a transaction. Check both the conversion fee and the exchange rate used. A percentage charge and a rate markup can produce similar costs under different labels.
Consider a hypothetical $2,000 equivalent conversion with a 0.5% charge. The conversion costs $10. Converting the same equivalent amount back at another 0.5% adds $10, ignoring exchange rate movements. That $20 round trip matters even if the stock commission is zero.
Ask whether sale proceeds can remain in the foreign currency for later purchases. If the account permits that, it may avoid repeated conversions, but holding foreign cash leaves you exposed to exchange rate movements. Avoiding a fee does not remove the currency risk.
For funding, check charges at both ends: the trading provider and the bank or payment service. Compare the amount sent with the amount credited, using the same currency where possible. For practical checks on payment routes and account credits, see deposits and withdrawals through trading apps.
A fixed withdrawal charge can weigh heavily on small transfers. A hypothetical $5 fee consumes 5% of a $100 withdrawal but 0.5% of a $1,000 withdrawal. Plan cash movements around genuine needs, not a fee waiver that encourages you to leave money somewhere unsuitable.
Subscriptions, Market Data and Investment Expenses
Evaluate paid app features as a separate purchase. Before subscribing, name the function you need, how often you will use it and what you would otherwise pay. More chart indicators do not automatically justify another monthly bill.
For a hypothetical $15 monthly plan, the annual cost is $180. Against a $2,000 account, that equals 9% of the starting balance before trading costs. Against $20,000, it equals 0.9%. A flat subscription can be modest in dollars and expensive relative to a small account.
Where a plan offers commission discounts, calculate its break even point. If it costs $10 a month and genuinely saves $1 on each eligible order, ten orders recover the subscription charge. Do not place extra trades to reach that number. Spending money to justify a discount defeats the exercise.
Fund expenses require separate attention. An ETF can involve both trading costs and ongoing operating expenses; a zero dealing commission does not eliminate the latter. The SEC investor bulletin on ETFs identifies brokerage commissions and annual operating expenses as separate costs to assess.
As a rough illustration, a 0.20% annual expense ratio on an unchanged $10,000 holding represents $20 a year. Actual expenses depend on the fund and changing asset values. When reviewing reported fund performance, check whether expenses are already reflected before subtracting them again.
A Worked Mobile Trading Cost Comparison
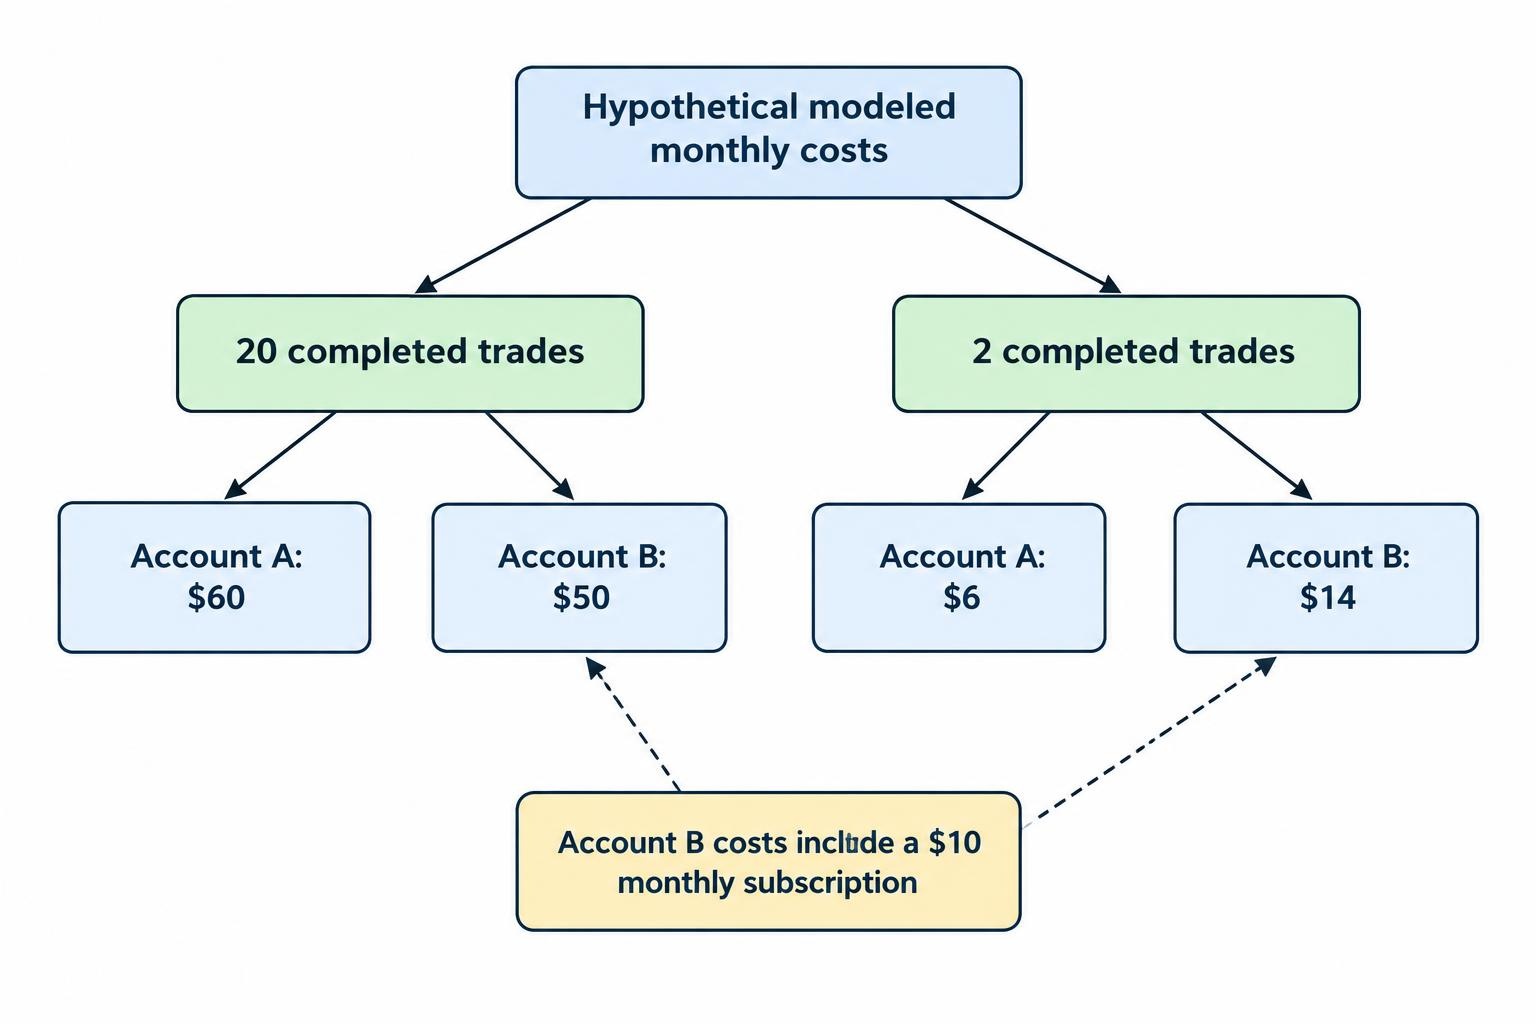
Compare accounts with the same activity rather than lining up unrelated headline fees. The following example assumes 20 completed trades a month. Each trade opens and closes the same 100 share position. There is no borrowing, currency conversion or fund expense in this illustration.
| Monthly cost assumption | Account A | Account B |
|---|---|---|
| Commission per executed order | $0 | $0.50 |
| Assumed spread cost per completed trade | $3 | $1 |
| Commission across 40 orders | $0 | $20 |
| Spread cost across 20 completed trades | $60 | $20 |
| Monthly platform subscription | $0 | $10 |
| Total modeled monthly cost | $60 | $50 |
Account B costs less under these assumptions despite charging commission and a subscription. This does not establish that commission accounts provide better prices. It shows why the spread and trade count can change the answer.
Now reduce activity to two completed trades. Account A costs $6; Account B costs $14, including its subscription. The same pricing schedules produce a different result because the usage changed.
Spread estimates also need care. Compare the same instrument, size and trading period, and do not treat the lowest advertised spread as a guaranteed execution cost. Broader account suitability belongs alongside the numbers, as covered in choosing a broker for mobile trading.
How to Check Your Actual Trading Costs
Build a monthly record from trade confirmations and account statements. Record commissions, funding, conversion charges, subscriptions and money movement fees separately. Keep estimates of spread and execution effects in another column so you do not confuse them with cash deductions.
Use a consistent comparison point for execution reviews, such as the bid and ask recorded when submitting the order. A price observed several minutes earlier is a poor benchmark. Equally, a demo account is useful for learning the interface, not proof of what live execution will cost.
For each completed trade, calculate net profit or loss using actual purchase and sale proceeds, then deduct applicable explicit charges that are not already included. If your platform reports a net figure, establish what “net” includes before making further adjustments.
Review fixed costs against account size and variable costs against activity. A subscription may dominate a small, lightly used account; spreads or financing may dominate an active or borrowed one. If execution choices are creating avoidable price surprises, review the differences between mobile trading order types before changing providers.
The cheapest app for your needs is not necessarily the one with the lowest advertised commission. It is the account with a suitable service and a clear, acceptable total cost for the trades you actually intend to make.